How to Create Engaging Social Media Content That Gets Noticed
social media content
Welcome Offer! Get 56% OFF!


Learn how to measure content performance with our expert guide. We'll show you the metrics, tools, and strategies that actually drive growth.
Welcome to the creator's dilemma. You're pouring your heart, soul, and probably way too much caffeine into creating amazing content, but is it actually doing anything? Is anyone out there? Measuring your content's performance is how you find out. It’s the bridge between your creative genius and real, tangible business results.
This isn't about getting bogged down in endless spreadsheets. It's about knowing for sure what moves the needle, so you can stop guessing and start growing.
Let's be honest, we've all been there. You hit "publish" and hope for the best, crossing your fingers that the internet gods will smile upon you. That's the "post and pray" cycle, and it's time to break free.
Think of measuring your content as having a direct line to your audience. Every click, every share, every second they spend on your page is feedback. It tells you what they love, what bores them, and what makes them pull out their wallets. We're going to demystify this whole process and turn your hunches into a rock-solid, data-driven strategy.
This guide is your roadmap. We’ll cover how to:
Set goals that actually mean something. Before you track a single metric, you need to know what you’re trying to achieve. Pick the right numbers to watch. Forget vanity metrics. We’ll focus on the data that truly reflects success. Turn data into action. The whole point of this is to use what you learn to make your next piece of content even better.
Whether you're building a personal brand, marketing a product, or trying to become the next big thing, this is non-negotiable. Tracking performance is the only way to truly understand your audience, prove your marketing efforts are worthwhile, and get consistently better over time.
Imagine knowing exactly which blog post topics lead to the most newsletter sign-ups. You’d write more of those, right? That's the power we're talking about.
The goal is to inspire action, not just get eyeballs. Proper measurement is the only way to know if you're hitting the mark. It empowers you to do more of what works and confidently ditch what doesn't.
This data-first mindset applies everywhere. If you're a content strategist who also dabbles in mobile, understanding things like App Store Optimization (ASO) offers a great parallel. Both are about defining what success looks like in a specific environment and then meticulously tracking the right metrics to get there. It’s all about connecting effort to outcome.
Ultimately, learning to measure your content turns your creative instincts into a reliable engine for growth. It ensures all your hard work pays off instead of just vanishing into the digital noise.
And for those of you with sky-high ambitions, once you nail down your measurement game, you can check out our guide on how to create viral content. The two go hand-in-hand.
Before you even think about opening a spreadsheet or staring at an analytics dashboard, you need to ask yourself a dead-simple question: Why?
Seriously, why are you even making this stuff? Without a clear destination, you’re just a ship without a rudder, hoping to randomly drift into a land of clicks and shares. This is where you define your "North Star"—the one big business goal that every single piece of content should be pointing toward.
Getting this right is what separates a real strategy from just throwing content at the wall and seeing what sticks. The goal isn't just to make noise; it's to make noise that leads to something tangible. Something profitable. Every goal needs a different roadmap and its own set of Key Performance Indicators (KPIs).
Your content's job should be a direct reflection of what your business needs right now. Are you a brand-new company trying to get on the map? Or are you an established player laser-focused on ringing the cash register? The answer changes everything about what "success" looks like.
Let's get real for a second. Imagine a few different scenarios:
An influencer dropping a new merch line: Their main goal is pure brand awareness. They’ll be watching reach, impressions, and social shares like a hawk. They just want as many eyeballs on those new hoodies as humanly possible. A B2B software company: They're all about lead generation. Success for them isn't page views; it's form submissions for a free demo or downloads of a juicy case study. They need qualified leads, not just traffic. An event planner pushing a big conference: The only thing that matters is conversion—selling tickets. They'll live and die by the conversion rate on their landing pages and promo videos.
This decision tree perfectly illustrates the two roads you can take: the chaotic "post and pray" method or a smart, data-backed approach.
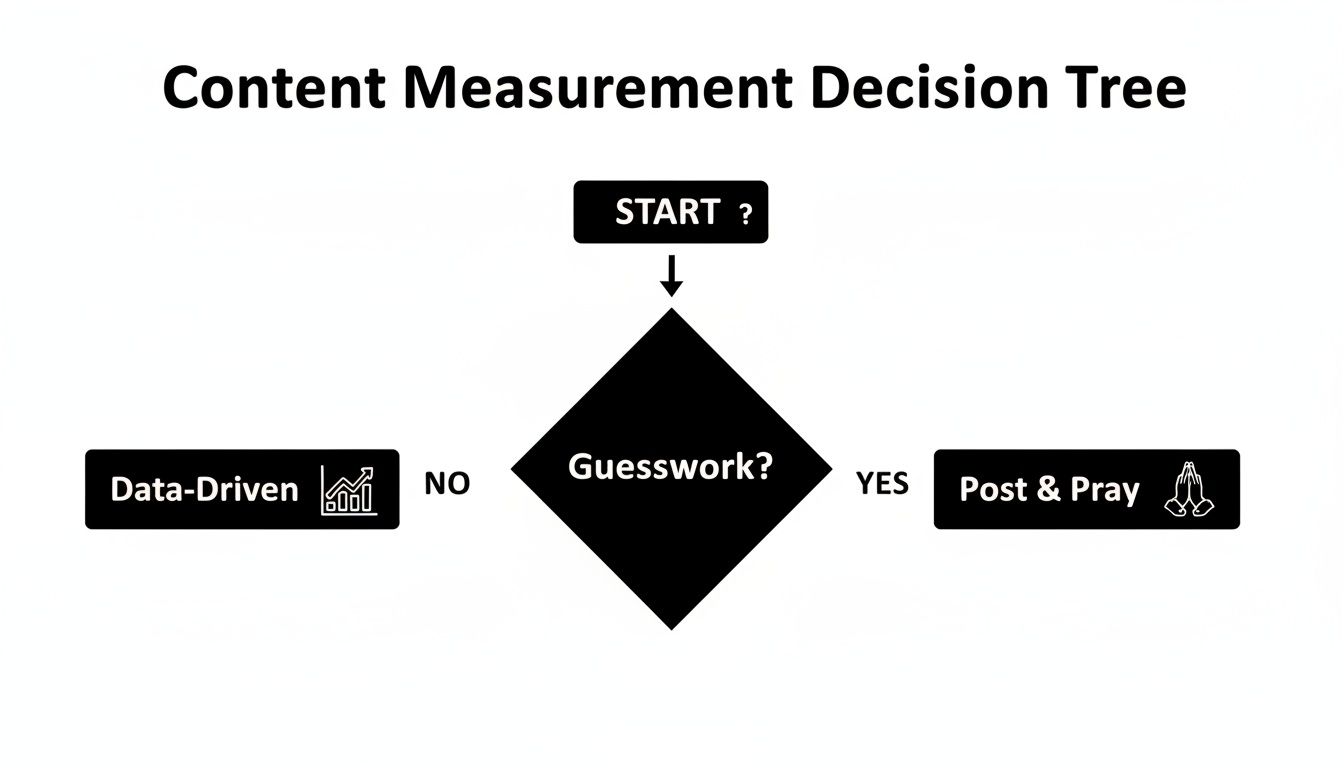
When you choose the data-driven path, you’re taking control. You're actively connecting your creative work to real-world results and leaving guesswork in the dust.
By defining your goal upfront, you give every piece of content a specific job to do. This clarity turns your measurement from a chore into a powerful feedback loop, telling you exactly what works.
Once you’ve nailed down your main goal, picking the right KPIs is suddenly a breeze.
If your North Star is to build a die-hard community, your most important KPI isn't just follower count. It’s your engagement rate—the percentage of your audience that actually bothers to like, comment, and share. You’re measuring loyalty, not just a vanity number.
This whole process is about building your own custom measurement framework. You're not just grabbing some generic list of metrics off the internet; you're hand-picking the numbers that prove you're moving closer to your specific goals.
As you build out your strategy, it’s also a good idea to see how to use AI for marketing. These tools can give you a serious leg up on both creating content and tracking its performance, which fits perfectly with a data-first mentality.
Ultimately, spending time on this first step ensures you stop chasing shiny objects and start focusing on the data that proves your content is actually making a difference.
Alright, your content is out in the wild. But is anyone actually seeing it? Or, more importantly, are they caring about it? This is where we get into the good stuff—the metrics that tell you if people are actually connecting with what you're putting out there. Think of it as the digital version of applause.
We're moving past the simple vanity metrics. A "like" is nice, but it's just the beginning of the story.
Real engagement tells you if you've hit a nerve. Think about an influencer trying to figure out why their latest TikTok went viral while the same video flopped on Instagram—that’s the kind of insight we're chasing here. A wave of shares means your message is really resonating, and a buzzing comment section is proof you've sparked a genuine conversation.
And this isn't just a gut feeling; the numbers tell the same story. A whopping 53% of marketers globally now say social media engagement is just as important as website engagement. In fact, HubSpot found that in 2024, 41% of marketers measured success almost entirely through engagement, a huge leap from just 29% the year before. The trend is crystal clear: we're all moving away from fluff and focusing on real interactions.
For a little extra proof, brands that jumped on personalized video saw 20% higher engagement rates in Q1 2025 than those still sticking to static posts.
Every click, comment, and share tells you something different about how your audience feels. To get the full picture of your content's performance, you have to learn to speak their language.
Here's a quick look at what these signals really mean:
Shares: This is the ultimate seal of approval. When someone shares your content, they're not just saying "I like this"—they're saying, "This is so good, I'm willing to attach my own name to it and show it to my friends." Comments: This is where your broadcast becomes a conversation. Comments mean you've said something compelling enough to make someone stop scrolling and type out a reply. You've turned a passive viewer into an active participant. Saves or Bookmarks: On a platform like Instagram, a "save" is pure gold. It means your content is so useful or inspiring that someone wants to come back to it again and again. It's a huge sign that you've created something with lasting value. Video Completion Rate: Did they watch 'til the end? This metric is a dead giveaway for how gripping your video content is. A high completion rate means your storytelling and pacing were on point.
Engagement is the pulse of your content. A strong, steady beat means your message is alive and well within your community. A weak pulse tells you it’s time to rethink your approach.
To help you get a handle on all this, here's a quick cheat sheet for the most important engagement metrics.
| Metric | What It Measures | Why It Matters | Pro Tip for SendFame Users |
|---|---|---|---|
| Shares | The number of times your content is shared to other networks or DMs. | This is the ultimate endorsement, indicating high value and trust. | Use SendFame to create videos so unique and personal that viewers can't help but share them. |
| Comments | The volume of direct replies and conversations on your post. | Shows you're sparking dialogue and building a community. | End your videos with an open-ended question to encourage viewers to drop a comment. |
| Saves/Bookmarks | How many users save your post to a private collection to view later. | Signals that your content is evergreen, useful, or highly inspirational. | Create "how-to" or tutorial-style personalized videos that people will want to save for reference. |
| Video Completion Rate | The percentage of viewers who watch your video from start to finish. | Reveals how compelling and well-paced your video content is. | Keep your SendFame messages concise and front-load the most exciting part to hook them early. |
Getting a grasp on these metrics is the first step. Now, let's talk about the nuances.
Keep in mind that engagement looks different on every platform. For example, when you're looking at a platform like Medium, signals like Medium claps are a key indicator of how much the audience appreciated what you wrote. On X (formerly Twitter), a bunch of retweets with comments shows a much deeper level of interaction than just a simple like.
Calculating your overall engagement rate is a solid start, but the real genius is in understanding the story behind the numbers. For example, getting a ton of likes but almost no comments might mean your visuals are great, but your caption didn't give people anything to talk about.
If your engagement numbers are looking a little sad, the answer isn't just to post more—it's to post smarter. For some killer, practical strategies, you should definitely check out our guide on how to improve social media engagement.
By zeroing in on these deeper metrics, you can stop shouting into the void and start building a real community that hangs on your every word.
Likes, shares, and retweets are nice little pats on the back. They feel good, but let's be honest—they don't keep the lights on. The real magic happens when we connect that awesome piece of content you created to actual business results. This is where we stop chasing vanity metrics and start tracking what really matters.
The ultimate goal here is a conversion. A conversion is simply when a user takes the exact action you wanted them to take. And no, it’s not always about whipping out a credit card. It’s any step that brings someone deeper into your world.

To get a true picture of your content’s financial muscle, you need to track both the big wins and the small nudges. I like to think of them as macro and micro-conversions.
Macro-conversions are the home runs. These are the actions that directly pad your bank account, like a product purchase, a signed contract, or a request for a high-ticket demo. They’re the "cha-ching" moments. Micro-conversions are the crucial stepping stones. These are the smaller commitments that show someone is interested and moving in the right direction. Think newsletter sign-ups, free guide downloads, or webinar registrations.
When you track both, you’re not just seeing the finish line; you’re mapping out the entire race. You can finally see how that one blog post led to a newsletter subscriber (a micro-win), who then, three weeks later, bought your flagship product (a macro-win). This is how you prove your content isn't just an expense—it's an investment.
The best content doesn't just get seen; it gets people to do something. Tracking conversions is how you follow the breadcrumbs from that first click all the way to a sale.
So, how do you pinpoint which blog post or video deserves the credit for a sale? Let's say you run a promotional video on a landing page. How can you prove that specific video drove sales, and not just random website traffic?
This is where you put on your detective hat and use some clever attribution tools.
UTM Parameters: These are basically little tracking codes you tack onto the end of a URL. They act like breadcrumbs, telling your analytics platform exactly where a visitor came from—was it your summer email campaign, a specific tweet, or a paid ad? Tracking Pixels: This is a tiny, invisible snippet of code (like the Meta Pixel) you place on your website. It's a digital spy that observes user actions, letting you know if someone who saw your ad on Facebook came back to your site later to make a purchase.
With these in your toolkit, you can confidently walk into a meeting and say, "Our Q2 video campaign generated $5,000 in direct sales." You can get some great ideas by checking out these brilliant digital marketing campaign examples and thinking about how they must have tracked their own success. This is the kind of hard data that turns your marketing efforts from a line item into a revenue-generating machine.
This isn’t just a niche strategy; it’s a global shift. Marketers who use this kind of multi-touch attribution have found that content is responsible for 15-25% of their total conversions. While the average B2B content conversion rate hovers around 2.35%, some strategies blow that out of the water. We’ve seen AI-personalized video campaigns, for instance, hit conversion rates as high as 4.8%. The proof is in the numbers.
So, you've managed to get people to your website. Awesome. But getting them through the door is only half the job.
The real question is, do they stick around? Or do they hit the back button faster than a cat chasing a laser pointer? This is where we figure out if your content is actually any good by looking at how people behave once they're on your site.
These on-site metrics are the breadcrumbs that lead you to what your audience really thinks. They give you the raw, unfiltered truth about the user experience, telling you if your content actually delivered on its promise.
Let's imagine a creator embeds their brand-new AI-generated music video on their online portfolio. They see a nice spike in traffic, which looks great on the surface, but they need to know the real story behind those clicks. Time to dig into a tool like Google Analytics.
Three key metrics will paint the full picture for them:
Time on Page: This one’s simple—it’s how long someone hangs out on a specific page. A high number is a fantastic sign that they’re actually reading, watching, or listening to what you've created. Bounce Rate: This is the percentage of people who land on a page and leave without clicking anything else. Think of it as someone walking into a store, glancing around, and immediately walking out. A high bounce rate can mean your content didn't meet their expectations. Dwell Time: This is the total time a visitor spends on your site after clicking a search result before they go back to the search page. It’s a massive signal to search engines that your content was relevant and helpful.
When you see a high Time on Page and a low Bounce Rate together, that’s your audience giving you a gold star. It’s their way of saying, "Yep, this is exactly what I was looking for, and it's interesting enough to keep me here."
Think of these metrics as a conversation. If visitors stay a while, they're leaning in, listening intently. If they leave immediately, you've lost their interest before you could make your point.
This genuine interest is what separates good content from truly great content. Across the web, the average Time on Page is expected to be around 52 seconds in 2025. But truly top-tier content, especially video, can blow that out of the water.
In fact, video content holds user attention 2.5 times longer than static images. This is huge for SendFame users, where AI-generated music and video content often sees engagement averages of 90 seconds—that’s double the 45-second average for typical static posts! As you can discover more insights about these content performance metrics, it's clear that longer dwell times can give your search rankings a serious boost, since Google sees it as a strong signal of quality.
If your on-site metrics are looking a little sad, don't sweat it. There are a few tried-and-true ways to make your site stickier and convince people to hang around.
First off, check your page speed. Nobody has the patience for a slow-loading site. If your page takes an eternity to load, visitors will be gone before they even see your masterpiece.
Next, focus on readability. Use short paragraphs, clear headings, and plenty of white space. No one wants to stare at a giant wall of text.
Finally, mix it up! Embed compelling media like videos, infographics, or interactive quizzes to break up the text and keep people engaged. These simple tweaks can make a massive difference in your on-site metrics.
Diving into content analytics can feel a bit like trying to read The Matrix for the first time. You see the numbers, you know they mean something, but it’s all just green code until you learn the language. Let's tackle some of the most common questions that pop up when you start measuring how your content is really doing.
Hold on. Before you even think about opening a single dashboard, you need to ask one simple question: "What's the point?" Seriously. What do you want a person to do after they've read your blog post or watched your video?
Is your goal to get your name out there? Drive clicks to your website? Get sign-ups for your newsletter? Make a sale? Your answer is everything.
Once you know the "why," you can pick a couple of Key Performance Indicators (KPIs) that actually tell you if you're succeeding. Don't go crazy and track 50 different things.
If you want brand awareness: Keep an eye on Reach and Engagement Rate. If you're after leads: The only number that matters is your form's Conversion Rate.
Finally, make sure your gear is set up. This usually just means getting Google Analytics installed on your site and poking around the built-in analytics on your social media profiles. Start small. Stay focused.
The classic rookie mistake is trying to track every single metric from day one. It's a recipe for burnout. Just pick one goal, a couple of KPIs that matter, and get really good at understanding them. You can always get fancier later.
There's no magic number here. The right pace for checking your stats depends entirely on where you're posting and what you're posting.
For hyper-speed platforms like TikTok or X (formerly Twitter), you might want to peek at the numbers daily for the first 48 hours to see if you've got a viral hit on your hands. But for a big, evergreen blog post? Checking in once a week to see how traffic is doing is perfectly fine.
For your bigger campaigns, I've found a weekly check-in followed by a deeper monthly or quarterly review works beautifully. The goal is to find a rhythm that gives you insights without driving you crazy. Set a recurring calendar reminder—say, every Monday morning—to look at your dashboards. This creates a routine and stops you from freaking out over a slow Tuesday.
Ah, the million-dollar question! This one trips up a lot of people, so don't feel bad.
Think of it this way: a metric is literally any piece of data you can track. Page views, likes, follower count, bounce rate—they're all just metrics. They're raw numbers.
A Key Performance Indicator (KPI), on the other hand, is a metric you've personally promoted. You've hand-picked it because it directly tells you if you're getting closer to a critical business goal.
So, while every KPI is a metric, not every metric gets to be a KPI. "Likes" on an Instagram post is a metric. But if your primary goal is to foster a loyal community, then your "Engagement Rate" (which bundles likes, comments, and shares) becomes your true KPI. It separates the signal from the noise.
Ready to create content that captivates your audience and drives real results? With SendFame, you can generate personalized celebrity videos, unique AI music, and stunning visuals in seconds. Stop guessing what works and start creating unforgettable experiences. Try it for free today.
Create Epic
SendFame
Create Epic with SendFame!
Questions: info@sendfame.com